For San Francisco, Alameda & Marin Counties
1st Half 2016 report, including 16 custom charts
Financial markets worldwide have seen dramatic volatility in this past 12 months, the Bay Area economy and new hiring have cooled, and the San Francisco house and condo market started to normalize after 4 feverishly overheated years. From a wide variety of sources, we are hearing of a big jump in apartment vacancy rates, with more apartments for rent than in many years, and the beginning of a decline in rent rates from recent all-time peaks. As would be expected, preliminary indications of a transition to a cooler market appear to be starting to show up in apartment building sales activity, but as illustrated in the charts below, no significant change is yet showing up in the statistics. The second half of 2016 will undoubtedly provide more insight regarding the speed and scale of any changes in market conditions.
Generally speaking, in the analyses below, we break out the 2-4 unit market from the 5+ unit market, as the two have some fundamental differences in market dynamics. The smaller buildings are often purchased by owner-occupiers, or, in San Francisco, by investors planning to sell the units separately as TICs. This significantly changes the financial evaluation of such properties.
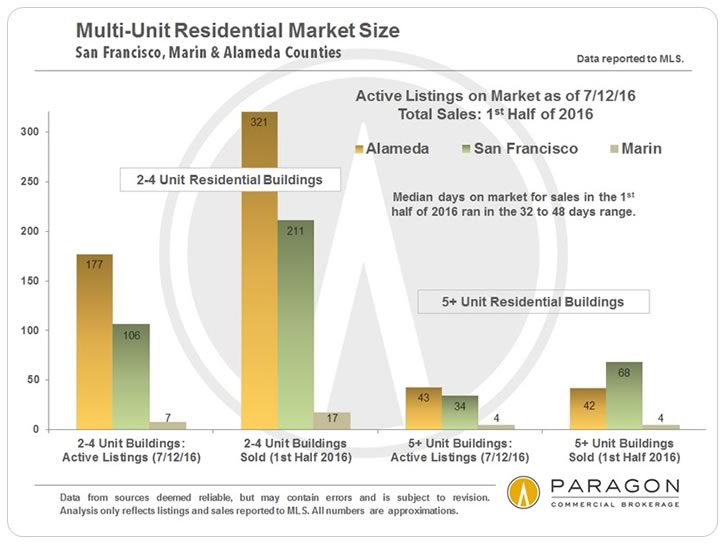
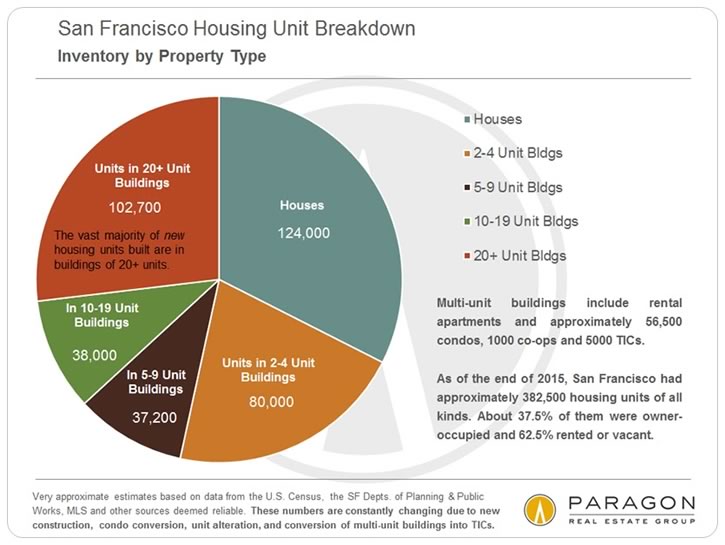
This first chart gives an idea of the sizes of the markets in San Francisco, Alameda and Marin Counties.
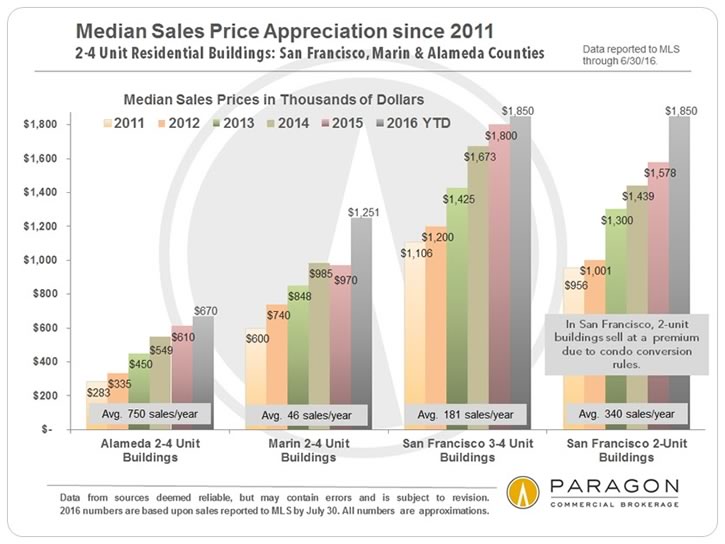
Median Sales Price and Dollar per Square Foot Trends
2-4 Unit Buildings: San Francisco, Alameda & Marin
2011 to 2016 YTD
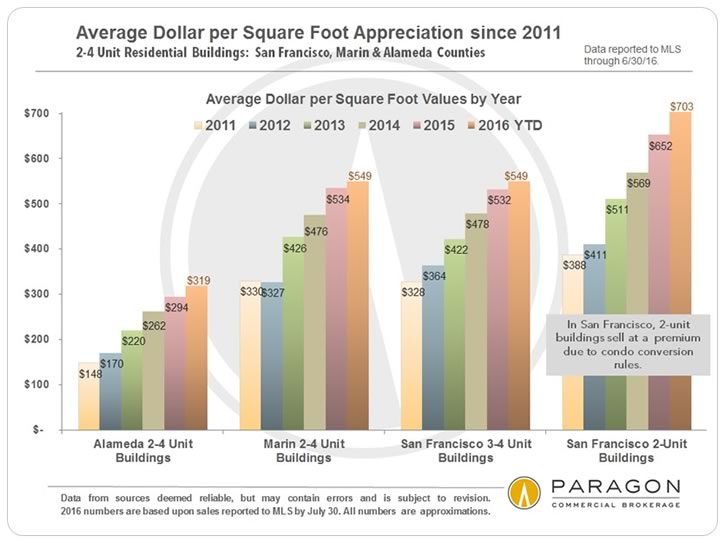
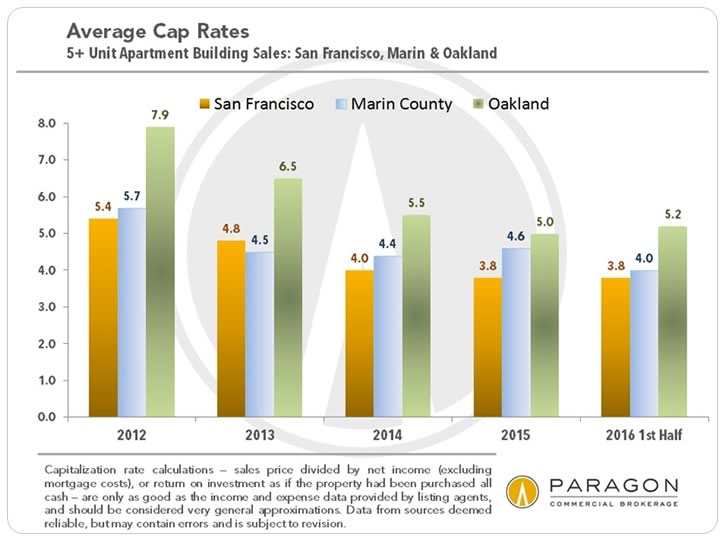
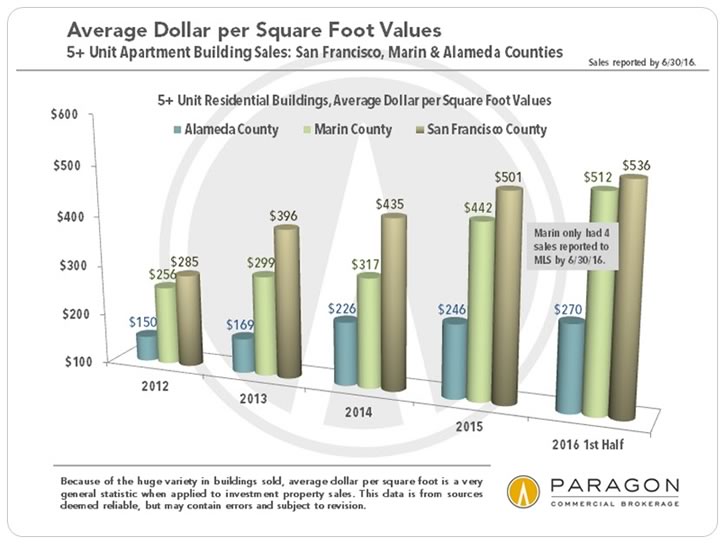
Cap Rate & Average Dollar per Square Foot Trends
5+ Unit Buildings: San Francisco, Alameda & Marin
2012 to 2016 YTD
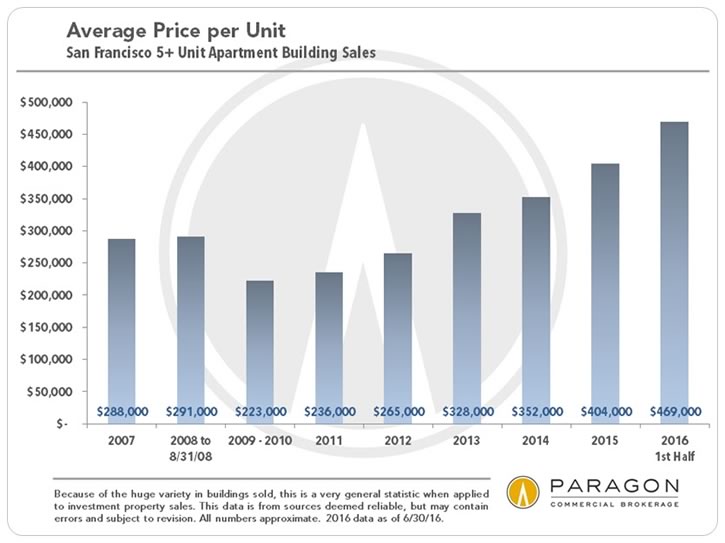
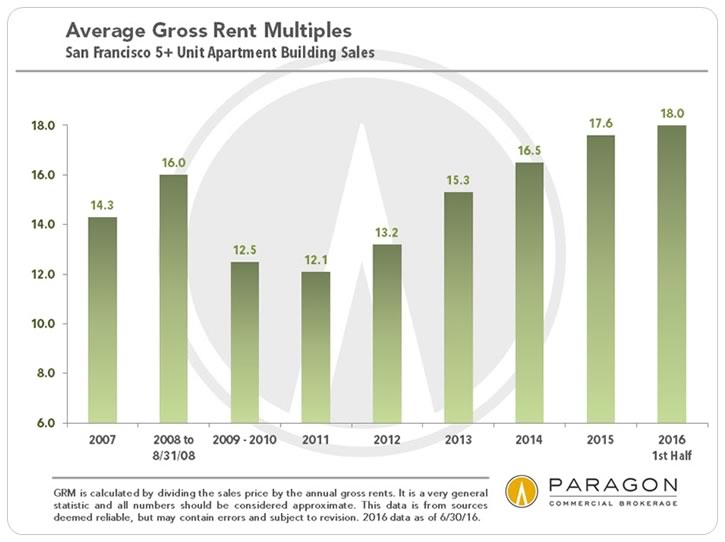
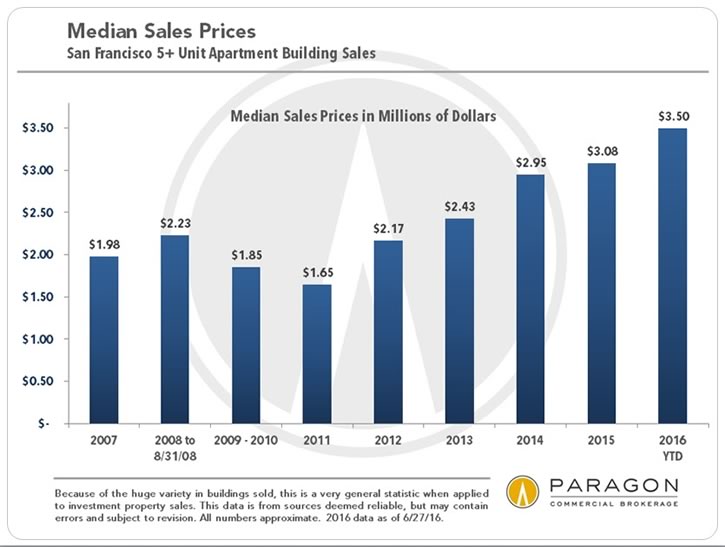
Price per Unit, Gross Rent Multiples, Median Price Trends
5+ Unit Buildings: San Francisco Only
2007 to 2016 YTD
Further information regarding San Francisco neighborhood submarkets can be found in our last 2 reports: Q1 2016 & 2015 Market Reports
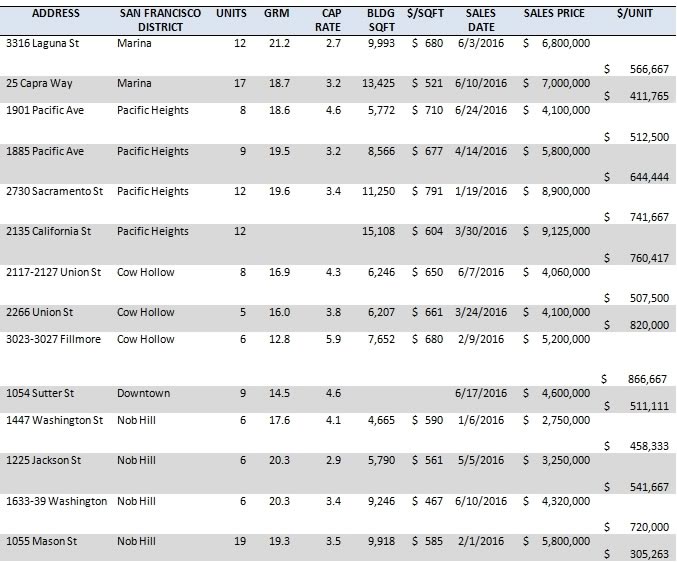
Below is one section of our list of 5+ unit apartment building sales reported to MLS in the first half of 2016. The full list is here: San Francisco Apartment Building Sales
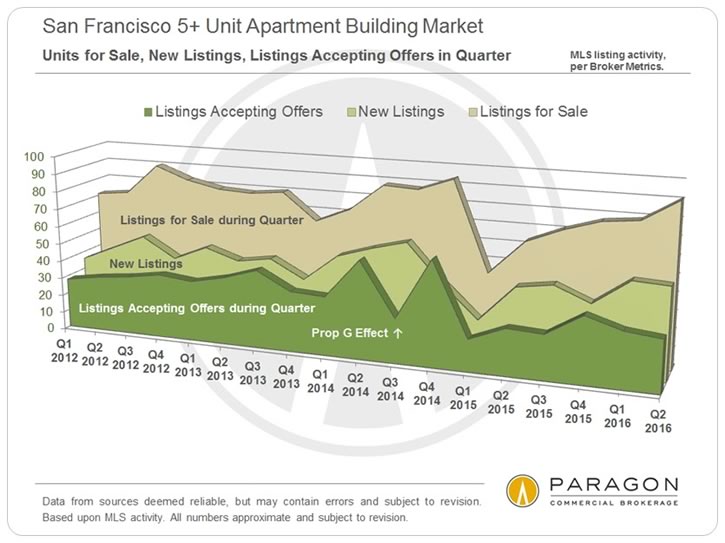
Inventory, Demand, Price Reductions & Expired Listings
Multi-Unit Apartment Buildings in San Francisco
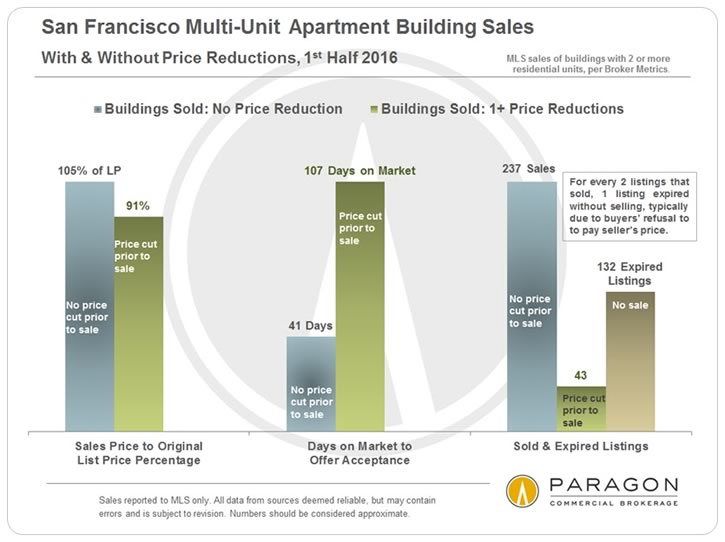
As seen in the second chart above, most of the SF multi-unit buildings that closed escrow in the first half of 2016 sold relatively quickly and averaged 5% over the original asking price. Buildings that went through price reductions before selling took much longer and sold at significant discounts. And quite a few listings expired or were withdrawn without selling, a clear indication of a substantial disconnect between what many sellers wanted and what buyers were willing to pay.
San Francisco Housing Inventory & Era of Construction

San Francisco New Housing Construction Pipeline
One of the big dynamics playing out in both the SF residential home and residential investment markets is the large number of new housing projects that have recently come on market or expected soon. Note that of projects under construction or approved by Planning (and leaving aside the long-term mega-projects such as Treasure Island), rental units outnumber condo (sale) units by about 2 to 1. This is a very recent development in SF housing construction, which saw virtually no market-rate rental housing construction for decades. (See era of construction chart above.) This expected rush of new rentals, most of which are at the (very) high end of rental cost, is coming just as the rental market is clearly softening in the city.
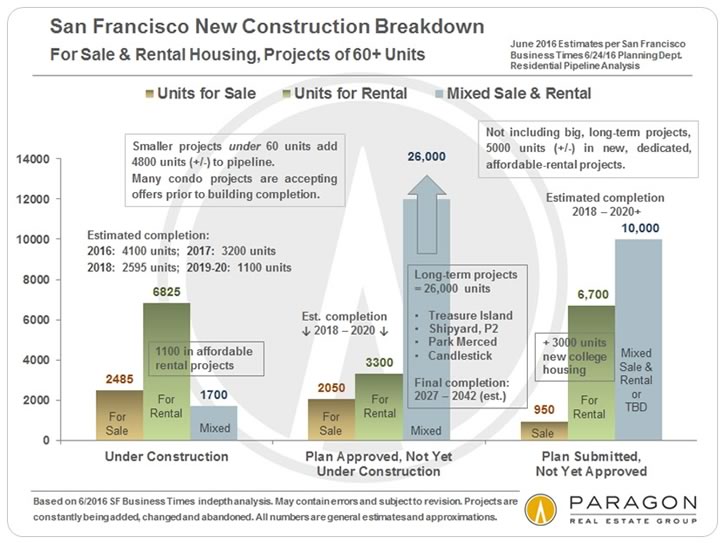
The chart above is based upon the San Francisco Business Times superb in-depth analysis of the many housing projects, rental and sale, market rate and affordable, currently in the Planning Department new construction pipeline, mapping and describing major projects of 60 units or more. Our chart attempts to summarize some of their data. Please note that projects are constantly being added, revised, sold to new developers, or even abandoned, and the median time from filing a plan to building completion is 3 to 6 years depending on the size of the project. Our full report is here: SF Housing Inventory and Pipeline Report.
Changes in San Francisco Employment Trends
What has been supercharging the Bay Area rental market for the past 5 years has been the incredible increase in new jobs, estimated at over 600,000 in the Bay Area, and 100,000 in San Francisco alone. This has put enormous pressure on rents throughout the metro region (the most expensive in the country) as new hires, many with very well paying jobs, desperately searched for housing. However, since 2016 began, it appears that the trend in new hiring has reversed, just as new rental housing inventory has been hitting the market in quantity: Significantly less demand, extremely high rents and increased supply of apartments for rent is creating a new reality, at least for the time being. The most expensive segment, especially in those areas where new construction is clustered, is probably most affected: Almost all the new, market-rate inventory is concentrated in the highest price ranges.
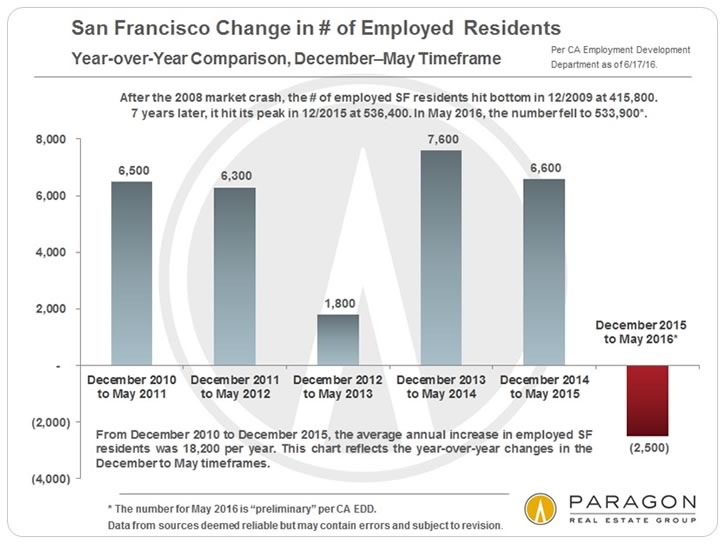
Our report on rental market trends is here: Bay Area Rent Report
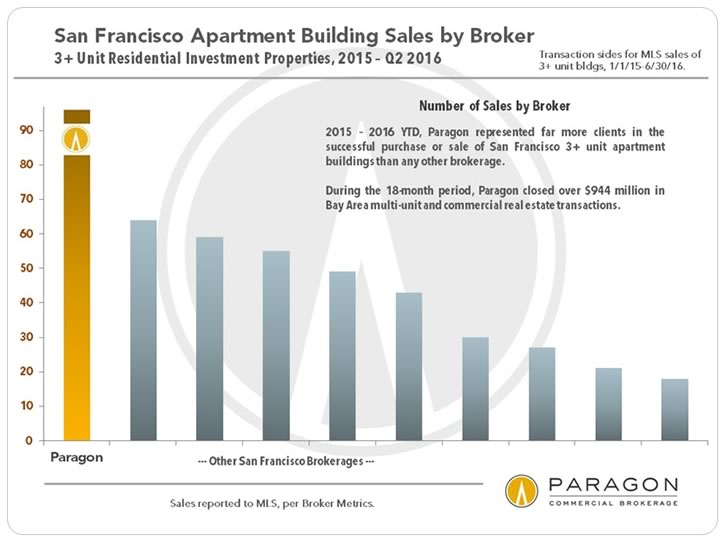
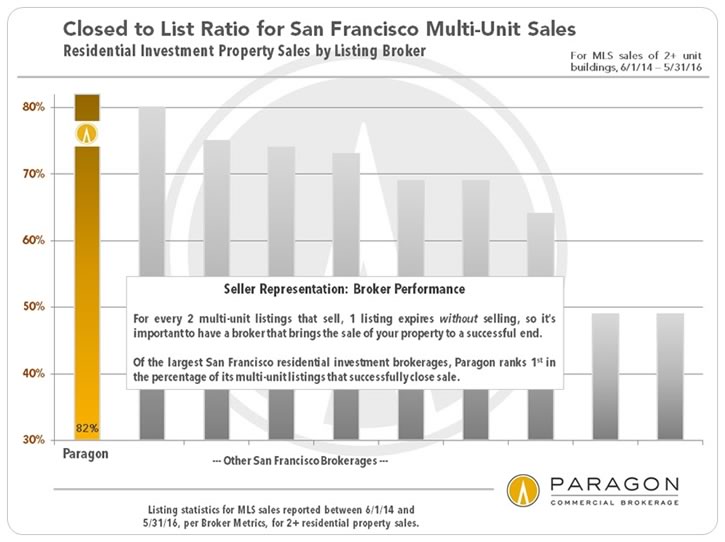
Broker Performance: Residential Multi-Unit Sales
Paragon Commercial Brokerage Listings
Please contact me with any questions or if I can be of assistance in any other way.
These analyses were made in good faith with data from sources deemed reliable, but they may contain errors and are subject to revision. Statistics are generalities and all numbers should be considered approximate. Properties not listed on or reported to MLS are not counted in these statistics, though they often affect market dynamics. Sales statistics of one month generally reflect offers negotiated 6 to 8 weeks earlier.


